0–50
Good
Air quality is satisfactory; little or no risk.
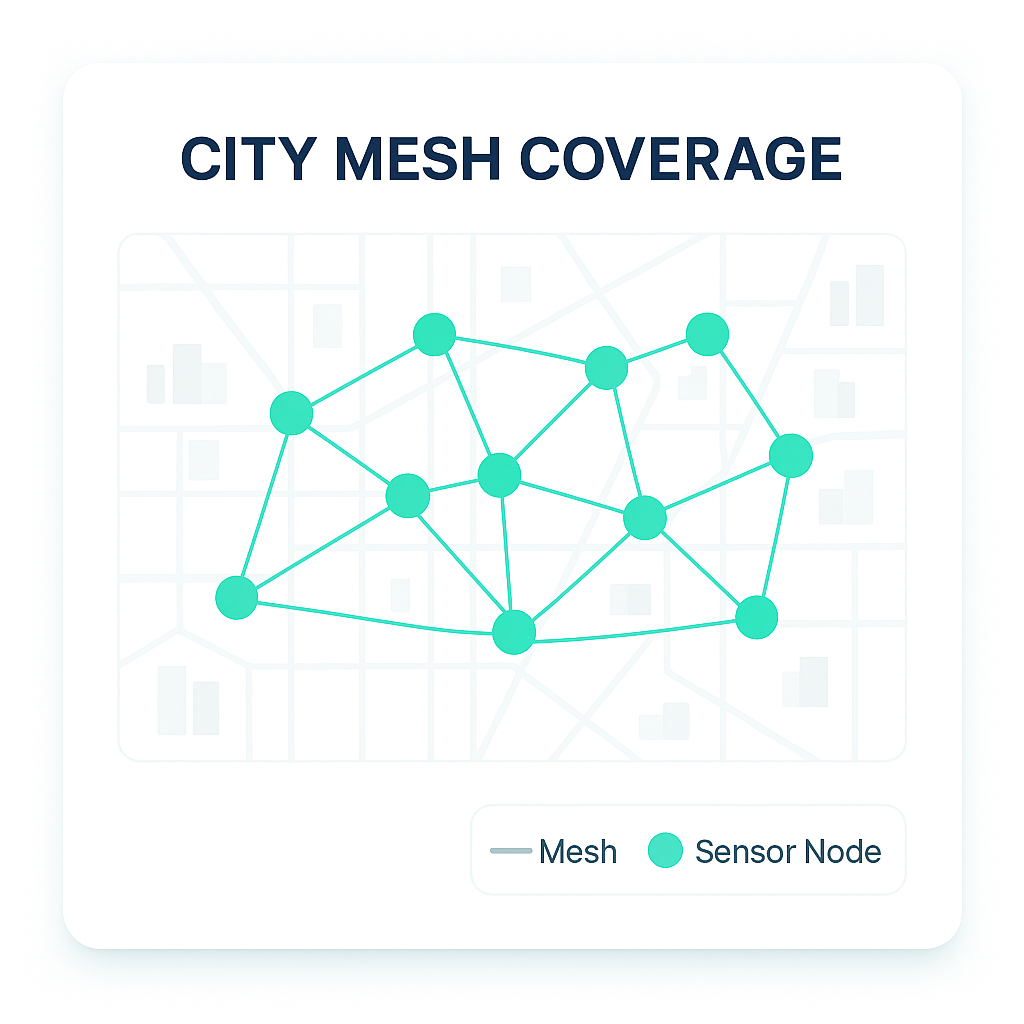
An intelligent sensor mesh that monitors air quality in real time — PM2.5, PM10, CO₂, temperature and humidity — with live map visualization and tamper-proof readings.

Every node maps to the standard AQI scale, so anyone can understand the air around them in a second.
0–50
Air quality is satisfactory; little or no risk.
51–100
Acceptable, but unusually sensitive people take note.
101–150
Sensitive groups may feel mild effects.
151–200
Everyone may begin to experience effects.
201–300
Health alert; serious effects for everyone.
301+
Emergency conditions; avoid outdoor activity.
Deploy sensor nodes, stream real-time data and visualize the mesh on an interactive map.
Smart Air-Quality Mesh is a connected network of smart sensor nodes that continuously monitor key indicators such as PM2.5, PM10, CO₂, temperature and humidity across many locations. Each node communicates within a distributed mesh, so real-time environmental data keeps flowing even where connectivity is limited. Built on open-access principles and integrated with the Hedera Hashgraph network, it guarantees data transparency, immutability and accessibility.
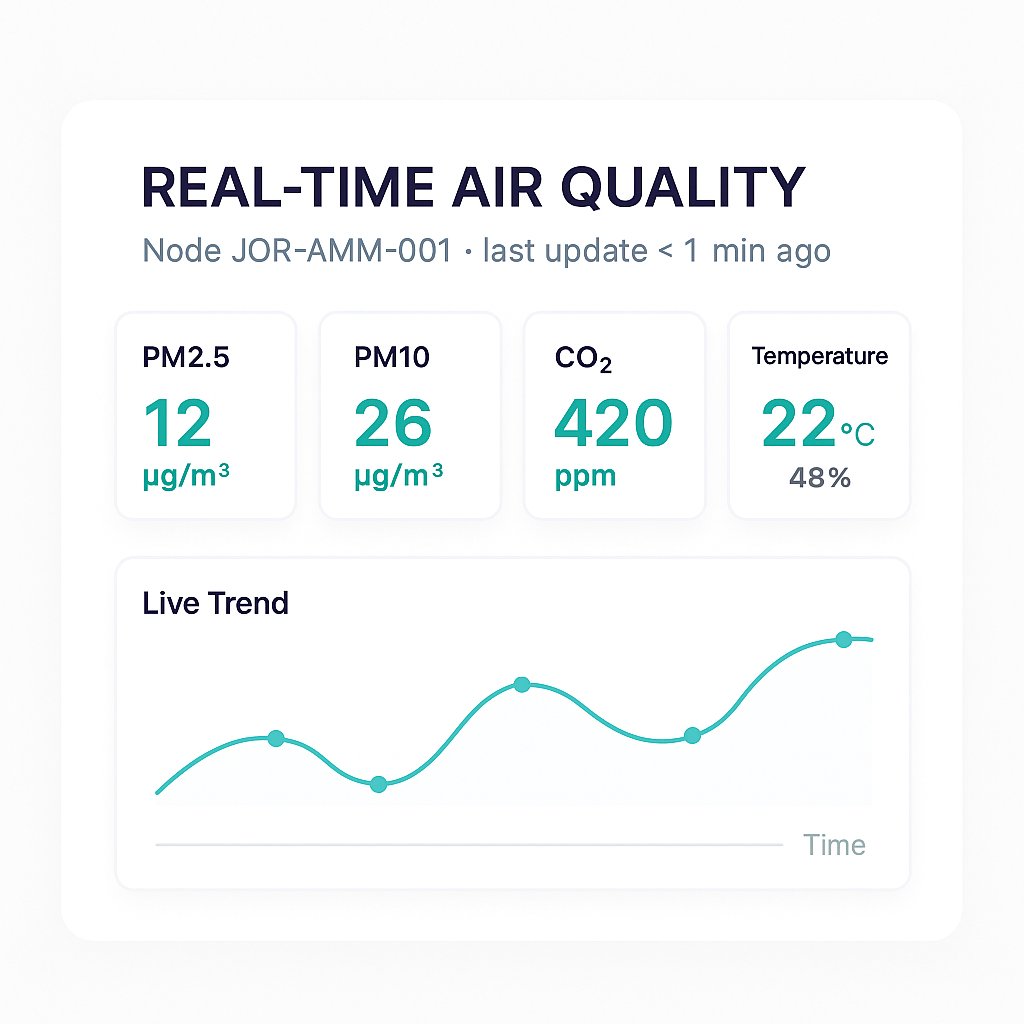
The system continuously measures PM2.5 and PM10 — fine and coarse particulate matter that can penetrate the respiratory system and impact human health. Monitoring these particles gives critical insight into pollution from traffic, industry and environmental conditions. CO₂ concentrations are also tracked to evaluate ventilation efficiency and detect areas with poor circulation or harmful buildup, indoors and out.
Everything you need to read the air — readings, maps, reports and alerts in one place.
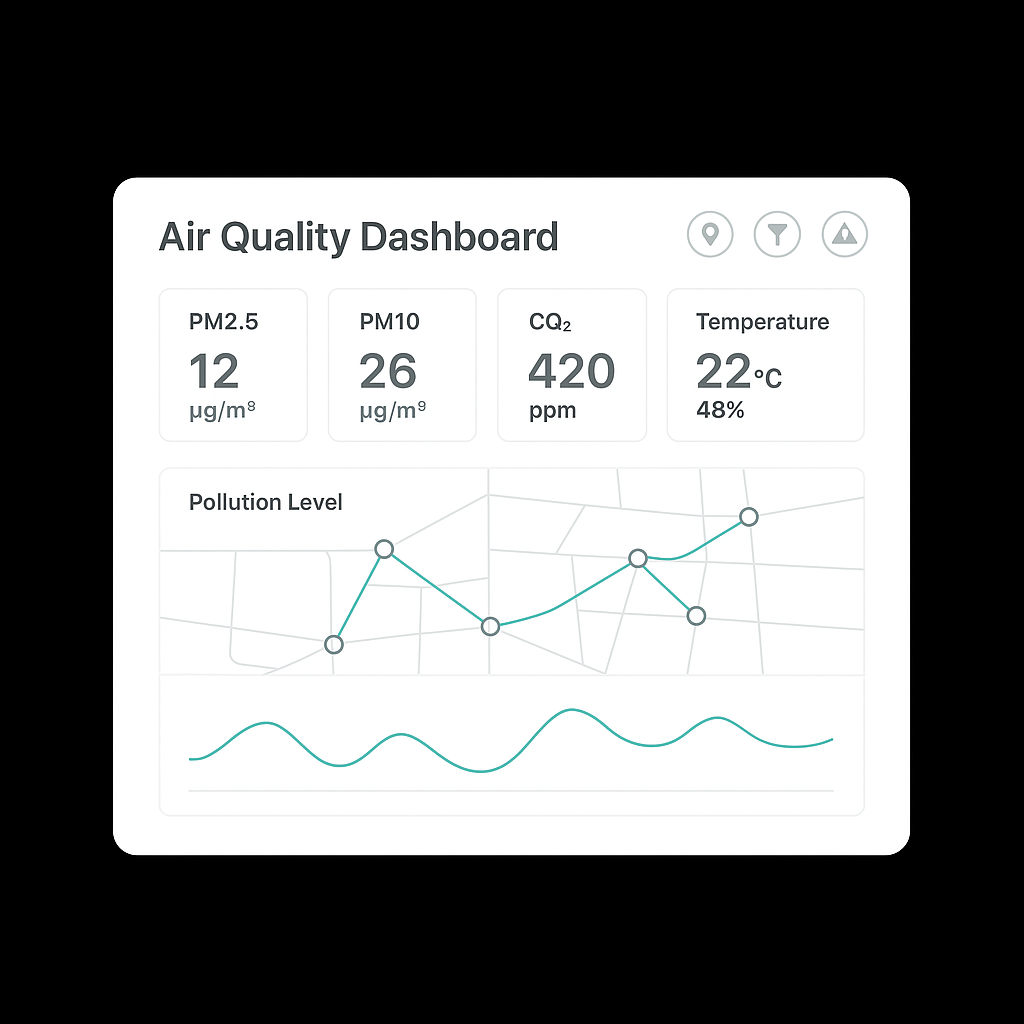
Track PM2.5, PM10, CO₂, temperature and humidity in real time across the mesh.
Visualize nodes on a city map, filter by area or pollutant and check node status instantly.
Generate downloadable reports, set thresholds and get alerts when pollution exceeds safe limits.
Anchor sensor readings on Hedera Hashgraph for immutable verification. Compute a SHA-256 proof locally, then publish a compact proof (node_id, ts, hash) via your backend to a Hedera HCS topic.
/api/hedera/publish.